We spent two days last week working on solo projects at Hack Reactor. I built a visualization of literary influences, beginning with Thomas Pynchon -- who, aside from being totally amazing, a genius, and one of my personal role models, also has a lengthy section on Wikipedia full of writers who influenced him and writers he's influenced.
Thomas Pynchon's circle of influence
To visualize the relationships between Pynchon and the writers connected to him, I created an arc diagram in D3. Initially, I planned on using D3's built-in chord layout generator, but I fell in love with arc diagrams after seeing so many beautiful examples online (e.g., Bible Cross-References, Command Usage Arc Diagrams, The Shape of Song, among others).
I went down a few rabbit holes, including creating a matrix dataset similar to those required by the chord layout and plotting the writers as nodes on a scale. Thankfully, there's this wonderful Les Misérables character co-ocurrences arc diagram, also in D3, which set me on the right track.
I formatted the influence data into an object with two arrays, nodes and links. Each node contains the name of a writer and a number indicating the writer's category (influencer or influencee), and each link contains a connection between Thomas Pynchon and another writer.
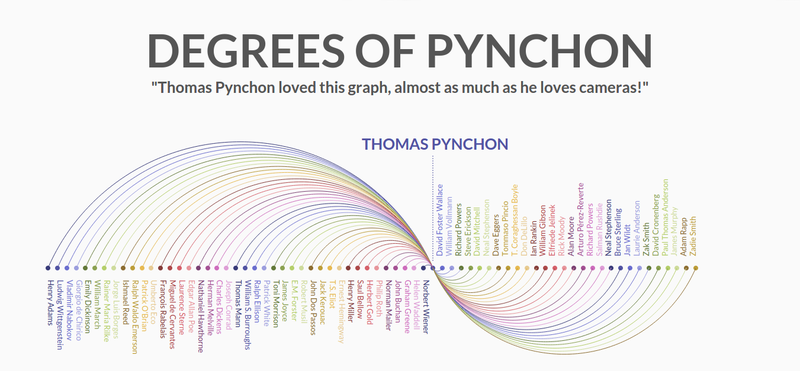
Click for the interactive version. I stole the quote from the Simpsons episode in which Thomas Pynchon reviews Marge's book. For anyone unfamiliar with Pynchon: he does not love cameras.
All the influencers appear to the left of Pynchon, with an arc above the horizontal; all the influencees appear to the right, with an arc below the horizontal. The colors were generated by D3's category20b scale.
Other circles of influence
I also wanted to visualize the influences of the other writers. Initially, I added all their connections to Pynchon's graph. This worked for Vladimir Nabokov but failed for Emily Dickinson, who was influenced by a writer who appeared to the right of her (Ralph Waldo Emerson) -- resulting in a backwards connection.
The solution was to create new graphs and layer them on top of Pynchon's. So, clicking on Nabokov's name (for instance) will fade out Pynchon's graph, increase the size of Nabokov's name, move his name and dot to the center of the page, draw a line from his name to the center dot, and display his influence graph around that new center. Mousing away from Nabokov's graph will delete his graph and bring back Pynchon's.
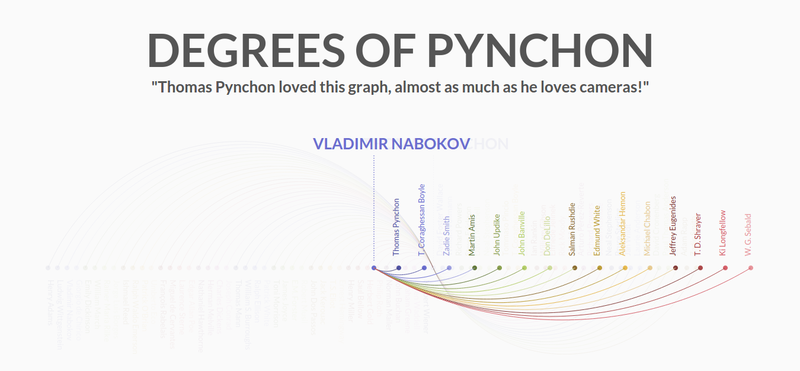
Vladimir Nabokov's literary influences
Figuring out how to rearrange the new graph around the new center dot was probably the most difficult part of the entire project. I passed the center position to the new graph and gave the influencer dots a negative x-axis position so that they appeared to the left of the center dot.
Hover selections
The last feature I added was a hover selection event. Mousing over a writer's name will fade out the entire diagram except for the name, dot, and arc belonging to that writer.
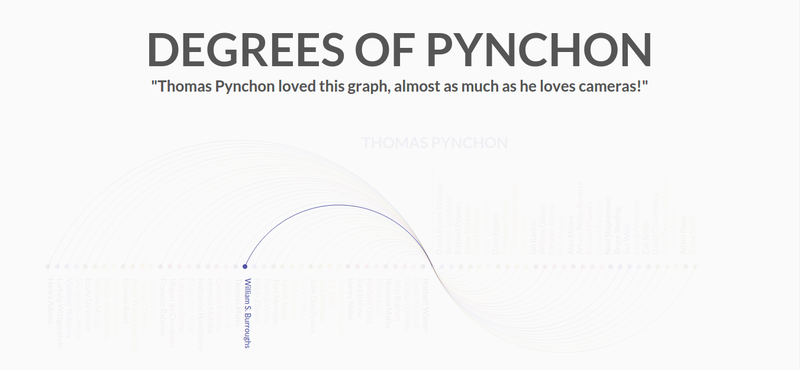
Hovering over William S. Burroughs
This was the second most difficult part of the project, because of the preexisting fade effects associated with the click event. The entire graph fades out upon clicking a name, and the entire graph fades back in when the mouse leaves the new graph.
I ended up initializing a boolean to keep everything in check: multipleGraphsOnPage starts off as false, becomes true when a new graph is created, and reverts to false when the new graph is deleted. The hover selection event is enabled only when multipleGraphsOnPage is false.
My project completion strategy
The purpose of the solo project was not to build a perfect product, but a minimum viable product. Hack Reactor instructed us to reduce the size of our scope in half, twice -- which I didn't even need to do, since I'd deliberately chosen a very small scope to begin with. The extra time afforded me the chance to polish the look and feel of my project, including the animations, and dive deeper into D3.
This project was really fun. D3 is by far my favorite JavaScript library ever, and I can't wait to make more visualizations with it.